
Federal Requirement 4.1
Student Achievement
The institution evaluates success with respect to student achievement consistent with its mission. Criteria may include: enrollment data; retention, graduation, course completion, and job placement rates; state licensing examinations; student portfolios; or other means of demonstrating achievement of goals.
Judgment of Compliance: Compliance
Narrative/Justification
for Judgment of Compliance:
Executive Summary
St. Petersburg College’s mission is to promote student success and enrich our communities through education, career development and self-discovery. SPC measures student success using multiple direct and indirect measures to evaluate fulfillment of the College’s mission. Three of the most distinct ways in which this is done is through the Florida State Comparison Measures, SPC College Experience student success initiatives, and academic program evaluation measures. The analytic results from each of these areas are shared with College leadership to determine student achievement. No measure stands alone but is regarded as part of the larger picture of our students’ achievement.
In addition, SPC has two distinct measures to look at the career development aspect of its mission, both of which are incorporated within the academic program assessment process: 1) State licensing examination pass rates are shared with the greater College community through the annual fact book and analyzed in the academic program assessment reports, and 2) Job placement rates are shared with College leadership and analyzed in the annual Academic Program Viability Report process.
Finally, SPC's Financial Aid Office monitors student success and academic achievement of financial aid recipients.
Florida State Comparison Measures
The Florida Community College System provides Statewide Accountability Measures that include success of AA and AS students, success of students required to enroll in college preparatory courses, retention of AA and AS degree students, AA degree transfer performance using upper division GPA, and program completion rates of AS degree and vocational certificate completers. These Statewide Accountability Measures are provided to the colleges on an annual basis. These reports provide value to the College leadership as they allow comparisons not only against overall state results, but against individual colleges within the system as well. (Note: Student success is defined as the percentage of students who have graduated, are enrolled in good standing, or left in good standing.)
Latest Annual Report Analysis
- The 2011 success rate1 was 82% compared to 85% statewide. SPC was under its target of 90%, although close to the statewide average.
- For students who had required college preparatory courses, the 2011 student success rate was 82% compared to a statewide average of 85%. SPC met its target of 75% for this group of students.
- The 2011 college preparatory retention rate2 was 72% compared to the statewide average of 69%. This was lower than the SPC target of 80%, although higher than the statewide average.
- The 2011 overall retention rate3 was 69% compared to 67% statewide. SPC was just under its goal of 70%, although higher than the statewide average. The 2011 graduation rate for these students was 32% for SPC compared to 37% statewide.
- SPC’s 2011 AA degree transfer with GPA’s greater than 2.5 was 78% and the College met its target of 70%. The mean GPA for the SPC transfer students was 2.95.
1Refers to the cohort of all SPC AA and AS degree students whose fourth year of attendance ended in Spring 2010 and Post-Secondary Certificate students whose third year of attendance ended in Summer 2008.
2The retention rate for students requiring college preparatory courses is calculated after the students who do not complete the highest preparatory requirement are eliminated from the pool.
3Refers to the cohort of all SPC lower division program and college credit certificate program students whose fourth year of attendance ended in Spring 2010 and Post-Secondary Certificate students whose third year of attendance ended in Summer 2008; pool includes first time in college (FTIC) students who have 18 or more credit hours.
In 1991, the Florida Legislature passed statewide accountability measures and defined state performance goals for each measure, and SPC leadership set the College-specific targets. Since that time both annual analysis and multi-year trend reports have been completed, shared, and posted on the Institutional Research website.
SPC College Experience Student Success Initiatives
St. Petersburg College developed data dashboards using a business intelligence tool to allow key internal stakeholders on each campus, in each academic unit, and each program to determine the history and status of student success in their area. The dashboards provide for the disaggregation of data related to: enrollment, retention, ethnicity, gender, programs, student success (defined as students receiving a “C” or better in a course and includes withdrawal and withdrawal/failure percentages), and some aspects of student engagement. Use of these dashboards has facilitated unit-level conversations and data confrontations to stimulate and support action to improve student success. The system of dashboards (as illustrated below) was entitled “SPC Pulse” and empowers users to maintain the “pulse” of their respective units. Making data readily available continues to reinforce data-based decisions.

Other student outcomes such as graduation information are provided as well. The screen shot below displays the number of SPC awards by gender and by term.

During the 2012-13 academic year, significant emphasis was given to monitoring the implementation of six college-wide initiatives related to student success under the umbrella of the College Experience program. The President facilitates weekly meetings, where he challenges staff members to display data descriptive of achievements and/or challenges associated with these (as illustrated below). The system gives College leadership the flexibility to view and analyze data at any time.

Academic Program Evaluation Measures
As part of the academic program evaluation process, two reports specifically focus on student success metrics: the Annual Program Viability Report (APVR), and the three-year Comprehensive Academic Program Review (CAPR) both stored within the Educational Outcomes website.
Annual Viability Reports
Annual Viability Reports are grouped by academic organization, which includes all academic degrees and certificates within each degree. Each year a set of measures focused on the College’s mission of student success, which are designed to evaluate a program’s viability, is reported. Currently there are seven measures:
1) SSH Enrollment
total number of student
semester hours within the greater academic org, made up of all
associated degree/certificates
2) Unduplicated Headcount
number of
students enrolled in degree/certificate within an academic org and
taking courses associated with that degree/certificate
3)
Performance Metric
divides actual enrollment within an academic org
by the sum of actual Equated Credit Hours offered within that org per
semester
4) Course Success Rate
percent of students completing
courses within the academic org with a grade of A, B, or C, divided
by the total number of students taking courses within the academic
org
5) Program Graduates
separated by degree/certificate
6)
Total Placement
percentage of graduates enlisted in the military,
employed, and/or continuing their education within the first year of
graduation
7) National, State and County Employment Trends
average annual job openings
After reviewing the statistical trends with program faculty and program coordinators, academic Deans follow-up on past year action plans, evaluate the impact of the action plans on program quality, create the next year’s action plan, identify special resources needed, and note area(s) of concern or improvement. All Viability Reports, upon completion, are printed, bound, and shared with the President for an overall College academic program review.
Comprehensive Academic Program Review
The Comprehensive Academic Program Review (CAPR) process is specifically designed to be a summative evaluation of the various academic programs at the College. It was developed to meet three objectives within the academic assessment process:
- To provide a comprehensive trend report that summarizes all elements of the program’s viability and productivity from a 360-degree perspective,
- To provide comprehensive and relevant program-specific information to key College stakeholders in order to make critical decisions regarding the continued sustainability of a program, and
- To provide program leadership a vehicle to support and document actionable change for the purposes of performance improvement.
Career Development Metrics
National and State Licensing Examinations
SPC offers a number of programs that require licensing examinations of graduates, either state or national. These include programs such as Dental Hygiene, Funeral Services, Nursing, Paramedic, Physical Therapist Assistant, Radiology, Respiratory Care, and Veterinary Technology. These programs utilize the results of their national and state licensing exams as part of their overall academic program assessment, analyzing specific sections of the tests that align to each program learning outcome (Example: Dental Hygiene Assessment Report). The licensing boards provide details on pass rates, number of candidates, and breakdowns of questions (Example: Dental Hygiene Letter). These analyses can be found within the Educational Outcomes website. Each program also provides their pass rates to the Department of Institutional Research to compile as part of the College fact book.
Following are the results for the various national and state licensing examinations shared in the 2011-12 SPC Fact Book:

Acceptable pass rate scores are set by each individual licensing board. In 2011-2012, most of the SPC pass rates were 84% or greater. Half of the programs listed (Dental Hygiene National, Dental Hygiene State Written, Education, Paramedic, Physical Therapy Assistant, and Radiology) had 100% pass rates. Pass rates of these exams are important to look at from an institutional standpoint, as they are directly related to whether students have been prepared by their program and whether they will be able to pursue a career in their chosen field.
Job Placement Rates
SPC uses job placement data from the Florida Statewide Accountability Measures, as well as job projections from various sources to inform College and academic program success.
The Florida Education and Training Placement Information Program (FETPIP) is a data collection and consumer reporting system established by Florida Statute 1008.39 to provide follow-up data on former students and program participants who have graduated, exited, or completed a public education or training program and can be located within the state of Florida. Job Placement rates are compiled by FETPIP and included as one of the Florida Statewide Accountability Measures that are provided to the colleges on an annual basis. In 1991, the Florida Legislature passed statewide accountability measures, defining the state benchmark for job placement as 90%, and SPC leadership set the College-specific target as 90% as well. The rate is composed of the number of records in the database of graduates that have related employment, are continuing their education, or are enlisted in the military. In 2011-12, SPC achieved a rate of 93% as compared to the 91% state average. This information is included in the annual Fact Book (p. 60) and as part of the annual and multi-year trend reports on State Accountability Measures that have been compiled, shared, and posted on the Institutional Research website.
Whereas FETPIP job placement data bases its percentages upon the total number of graduates that can be found in the state of Florida, the state also provides data based upon actual numbers of graduates per degree level, regardless of whether or not they reside in Florida. This information is located on the state website and allows for state college comparisons. The table below contains the continuing education and employment rates for 2010-11 AS degree graduates:

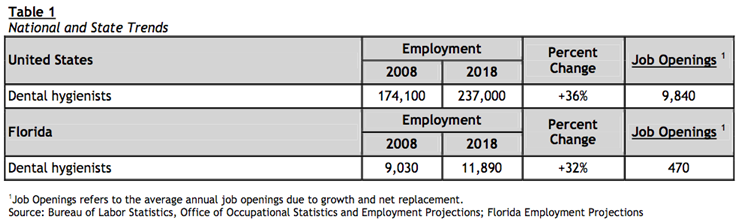
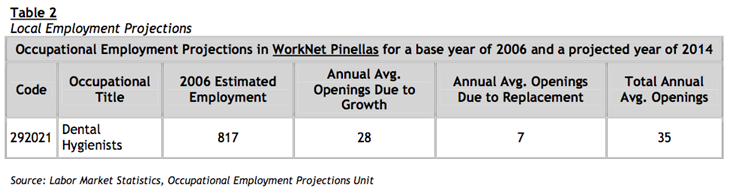
Whereas the Institutional Research reports allow for College-level benchmarking, the Department of Assessment and Effectiveness compiles two tables on national, state, and local job trend information for individual programs as part of the Annual Program Viability Report (APVR). The example below is from the 2010-11 Dental Hygiene viability report:
Financial Aid Office
In compliance with Title IV federal programs, the SPC Office of Financial Assistance Services monitors student success and academic achievement of financial aid recipients. There are also annual reviews by state and federal auditors to ensure proper tracking of satisfactory academic progress and withdrawals, both official and unofficial, for all students.
Historically, SPC has awarded financial aid to 50-60% of its enrolled undergraduate degree-seeking students. The SPC Office of Financial Assistance Services (FAS) monitors the academic achievement of financial aid recipients each semester according to standards specified in the Financial Aid Standards of Academic Progress Policy (SAP) that are included in the SPC College catalog and found on the SPC website. Students must demonstrate academic progress by completing a specified number of credit hours relative to the number of semester hours attempted, this is referred to as completion percentage. Students must also maintain specified Grade Point Averages (GPA’s) based on total semester hours earned. Failure to do so would cause the cancelation of future aid unless the student successfully submits a SAP appeal. Students are also not allowed to receive financial aid after they have taken 150% hours required for their degree program without successful SAP appeal as well.
As stated above, students who fail to meet these criteria are placed first on a warning status for a period of one term, if they are still not meeting the schools SAP requirements they are then place on financial aid suspension. SPC does have an appeal process in place to assist the students with extenuating circumstances, which may have occurred during the year in question. SPC calculates and monitors SAP status on all students at the end of every academic term/period.
In addition, the College tracks enrollment status of all students for the first two weeks of each term and again at the 60% mark of the term. If the student does not attend the first two weeks and is not actively participating at the 60% mark of the class, the student is considered to be a withdraw from that course. The “W” and “WF” grades enable the Department of Enrollment Management to identify, through weekly system reports, any student who has officially withdrawn.
The SPC's Office of Financial Assistance Services (FAS) receives weekly reports from the Department of Enrollment Management, which identifies students who have withdrawn from classes during the term. This data is used to calculate the student’s refund due to the US Department of Education through the Return of Title IV Assistance process. The FAS processes Return of Title IV Assistance and notifies the student and the US Department of Education of grant over-payments which may have occurred.
Supporting Documentation
In order to preserve the integrity of the supporting documentation in case of updates occurring between the submission of this document and the review, the narrative above links to pdf versions, whereas live links are included below.
- SPC Mission
- Institutional Research
- College Experience
- Educational Outcomes
- Comprehensive Academic Program Review (CAPR)
- Dental Hygiene Assessment Report
- Dental Hygiene Letter
- 2011-12 SPC Fact Book
- Florida Education and Training Placement Information Program (FETPIP)
- Florida Statute 1008.39
- Florida Department of Education Smart College Choices
- Satisfactory Academic Progress (SAP)